As Per MSDN:
"When a data page is read from disk, the page is copied into the SQL Server buffer pool and cached for reuse. Each cached data page has one buffer descriptor. Buffer descriptors uniquely identify each data page that is currently cached in an instance of SQL Server. sys.dm_os_buffer_descriptors returns cached pages for all user and system databases."
Thus, sys.dm_os_buffer_descriptors contains a row for every Page(8k) that has been cached in the Buffer Pool and this Dynamic Management View can be used to determine how much Buffer Pool Memory each database and it's objects are consuming. It is recommended to monitor, log & alert on these values over time and especially track if any changes occur due to Database Code Releases.
T-SQL:
Get Database Buffer Pool Memory Usage Per Database:
SELECT
CASE database_id WHEN 32767 THEN 'Resource DB' ELSE DB_NAME([database_id]) END AS 'Database',
COUNT_BIG(*) '# Buffer Pool Pages',
COUNT_BIG(*) * 8 / 1024 'Buffer Size (MB)'
FROM sys.dm_os_buffer_descriptors
GROUP BY database_id
ORDER BY '# Buffer Pool Pages' DESC;
Get Database Buffer Pool Memory Usage Per Database Per Objects:
Declare @DBID int
Select @DBID = database_id from sys.databases where name = 'xyz';
--Select @DBID
WITH cte AS
(
SELECT
p.[object_id], a.allocation_unit_id, p.index_id, o.name as 'Object', o.type_desc as 'Type',
COALESCE(i.name, '') as 'Index', i.type_desc as 'Index_Type'
FROM sys.partitions AS p
INNER JOIN sys.allocation_units AS a ON p.hobt_id = a.container_id
INNER JOIN sys.objects AS o ON p.[object_id] = o.[object_id]
INNER JOIN sys.indexes AS i ON o.[object_id] = i.[object_id] AND p.index_id = i.index_id
WHERE a.[type] IN (1,2,3)
)
SELECT
cte.[Object], cte.[Type], cte.[Index], cte.Index_Type,
COUNT_BIG(b.page_id) as '# Buffer Pool Pages',
COUNT_BIG(b.page_id) * 8 / 1024 as 'Buffer Pool Size (MB)'
FROM cte
INNER JOIN sys.dm_os_buffer_descriptors AS b ON cte.allocation_unit_id = b.allocation_unit_id
WHERE b.database_id = @DBID
GROUP BY cte.[Object],cte.[Type],cte.[Index],cte.Index_Type
ORDER BY '# Buffer Pool Pages' DESC;
To filter out INTERNAL_TABLE and SYSTEM_TABLE:
WHERE
a.[type] IN (1,2,3) and o.is_ms_shipped = 0
Get Database Buffer Pool Memory Usage Per Object: (to examine each table)
Select * from sys.objects where name = ''
Select * from sys.partitions where OBJECT_ID =
Select * from sys.allocation_units where container_id = ''
--1 = In-row data (all data types, except LOB data types)
--2 = Large object (LOB) data (text, ntext, image, xml, large value types, and CLR user-defined types)
--3 = Row-overflow data
Select sum(total_pages) from sys.allocation_units where container_id = ''
Select * from sys.indexes where object_id =
Select * from sys.dm_os_buffer_descriptors where allocation_unit_id in ()
Select count(*) from sys.dm_os_buffer_descriptors where allocation_unit_id in ()
--TotalPages * 8 /1024 = MB or TotalPages/128 = MB (since 1024/8=128)
Get Page Life Expectancy (relates to SQL Server Process Memory Pressure) (Internal Memory Pressure)
Overall PLE:
SELECT [object_name],
[counter_name],
[cntr_value] FROM sys.dm_os_performance_counters
WHERE [object_name] LIKE '%Manager%'
AND [counter_name] = 'Page life expectancy'
PLE per NUMA Node:(check since one low value below can be masked by the overall PLE value)
SELECT [object_name],[counter_name],
[cntr_value] FROM sys.dm_os_performance_counters
WHERE [object_name] LIKE '%Buffer Node%'
AND [counter_name] = 'Page Life Expectancy'
Page Life Expectancy(PLE) measures the time a Page(without being referenced) will reside in the Buffer Pool BEFORE it is removed. PLE is measured in seconds and is a point in time value.
A commonly used value to alert on is based on your system configuration and using the formula DataCacheSizeInGB/4GB*300. i.e. 25GB Data Cache Size: 25/4*300 = 1875. Thus, if PLE drops below 1875 and stays, investigate to see why Data Pages are being removed from Buffer Cache so quickly - possibly due to activity such as missing indexes, table scans, large query executing, etc.
If memory pressure is removed, the PLE value will increase by 1 every second.
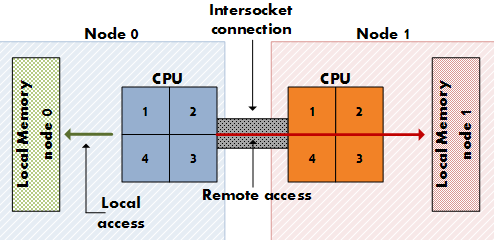
The Buffer Pool is divided up per NUMA node with each NUMA node getting it’s own lazy writer thread, own buffer free list, & node-local memory allocations.
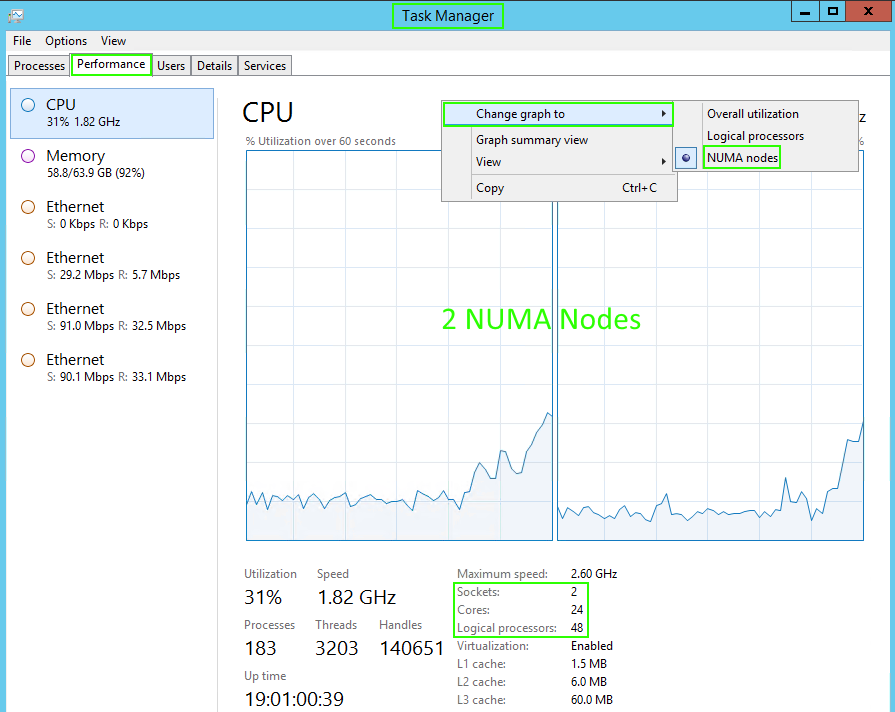
Get # NUMA Nodes on your Server:
NUMA means Non-uniform memory access. NUMA Nodes specifies which part of system memory is local to which CPU. Each Node contains processors and memory. Under NUMA, a processor can access its own local memory faster than non-local memory, that is, memory local to another processor or memory shared between processors. The idea is to avoid a performance hit when processors attempt to access the same memory.
Via Task Manager:
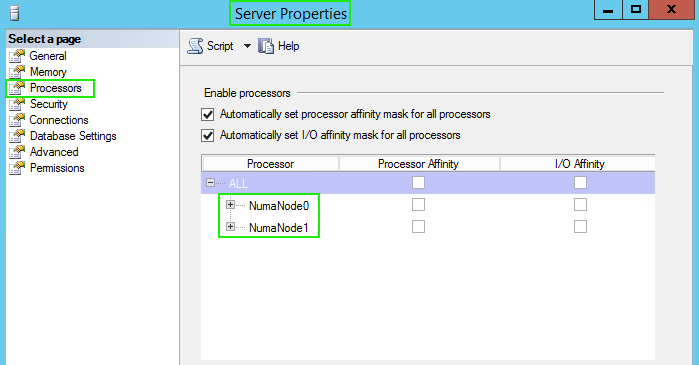
Via SSMS:
Via T-SQL:
Select * from sys.dm_os_memory_nodes
Select distinct memory_node_id from sys.dm_os_memory_clerks
For every available NUMA node, SQL Server creates one dedicated Memory Node (ignore Memory Node ID = 64 which is for the Dedicated Admin Connection).
To View CPU Schedulers: select * from sys.dm_os_schedulers
Via SQL Server Error Log:
SQL Server detected 2 sockets with 12 cores per socket and 24 logical processors per socket, 48 total logical processors;
Node configuration: node 0: CPU mask: 0x0000000000ffffff:0 Active CPU mask: 0x0000000000ffffff:0. This message provides a description of the NUMA configuration for this computer.
Node configuration: node 1: CPU mask: 0x0000000000ffffff:1 Active CPU mask: 0x00000000000000ff:1. This message provides a description of the NUMA configuration for this computer.
Resources:
Understanding Non-uniform Memory Access
|
|
|
|
|
|