Solution:
MSDN:
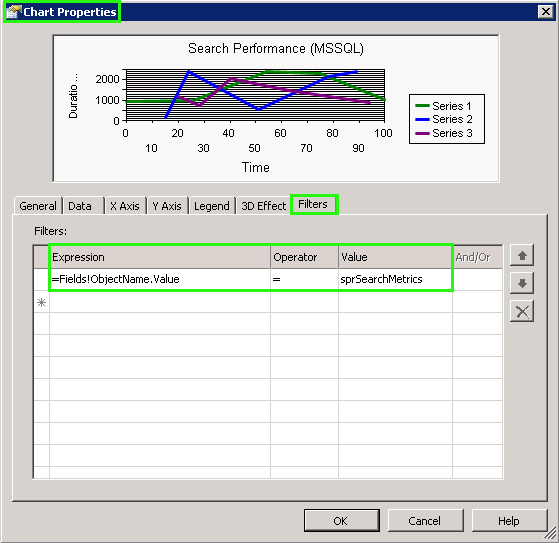
Add a filter to a dataset, data region, or group when you want to include or exclude specific values for calculations or display. Filters are applied at run time first on the dataset, and then on the data region, and then on the group, in top-down order for group hierarchies. In a table, matrix, or list, filters for row groups, column groups, and adjacent groups are applied independently. In a chart, filters for category groups and series groups are applied independently.
To add a filter, you must specify one or more filter equations. A filter equation consists of an expression that identifies the data that you want to filter, an operator, and the value to compare to. The data types of the filtered data and the value must match. Filtering on aggregate values for a dataset or data region is not supported.
To filter data points in a chart, you can set a filter on a category group or a series group. By default, the chart uses the built-in function Sum to aggregate values that belong to the same group into an individual data point in the series. If you change the aggregate function of a series, you must change the aggregate function in the filter expression.
Resources:
Add a Filter (Report Builder and SSRS)
|
|
|
|
|
|