A few years back I decided to create a custom Performance Monitoring, Alerting and Diagnostics Web Application for Microsoft SQL Server product. At the time I was a Senior Microsoft SQL Server DBA managing a large farm installation of Microsoft SQL Server and MySQL assets. Our environment was approximately 90% MSSQL and 10% MySQL installs, hosting data for an extremely busy website.
Now, I did have some prior knowledge of Web Development from past gigs but not too the extend this development project would require. The number one reason for taking on this project was a noticeable change in the landscape for MSSQL DBA's. The proximity with the developer world for many tasks was evident from the technology conferences I was attending at the time.
Throughout this project I would acquire invaluable knowledge of Microsoft Visual Studio, ASP.NET, VB.NET, HTML, JQUERY & CSS. The ability to customize the tool, to what I considered, were key MSSQL Engine components, features & metrics was a key ingredient into the overall success & enjoyment of this project. It took a little over a year for the Design & Development phases to complete & then commence Deployment into our Production Data Center Environments.
Obtaining a real-world dataset, which allowed for quick identify & fix product bug turnaround, was a really important component to this project. A strong data set is something any Developer or DBA would say are vital to the success of any software project.
Here is a technical overview:
Product Architecture:
Product Components:
•Microsoft Web Server IIS 7.0
•Microsoft .NET Framework 4.0
•Repository DB: SQL Server 2008 or above
•Monitored Servers: SQL Server 2008, SQL Server 2012 or SQL Server 2014
Product Features:
•Core Metrics
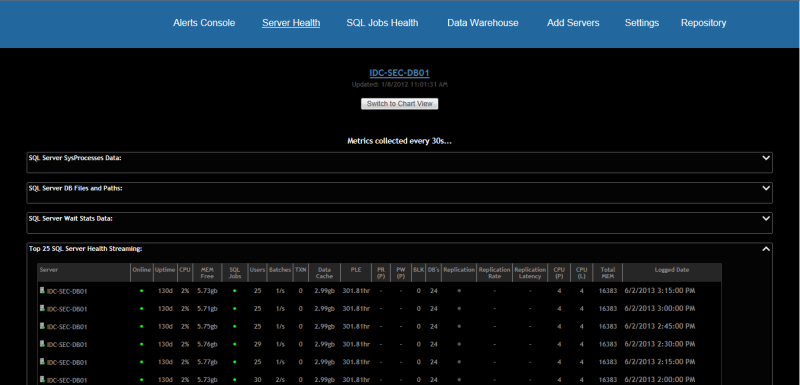
•Server Health
•Alerts Console
•Agentless
•Streaming Mode
•Charting Panels
•Thresholds
Image 1:
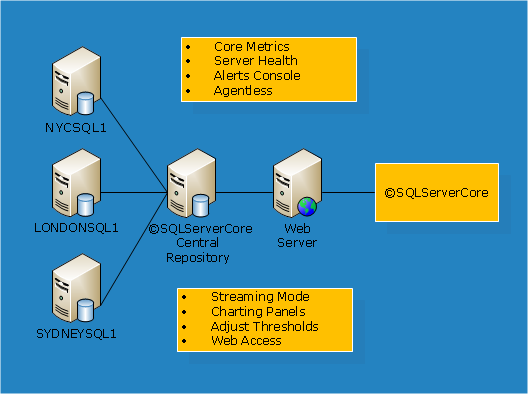
Image 2:
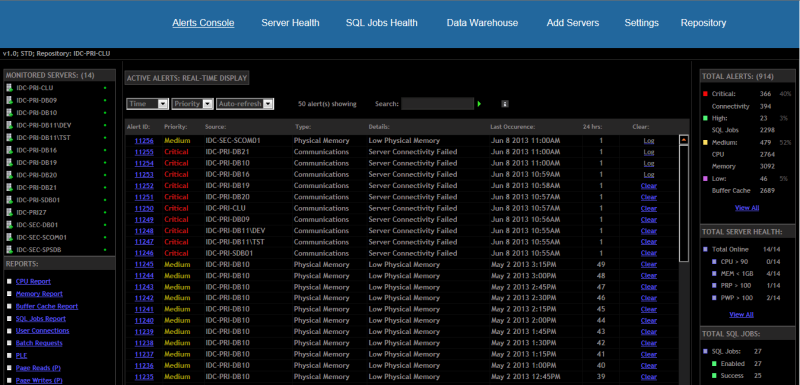
Image 3:
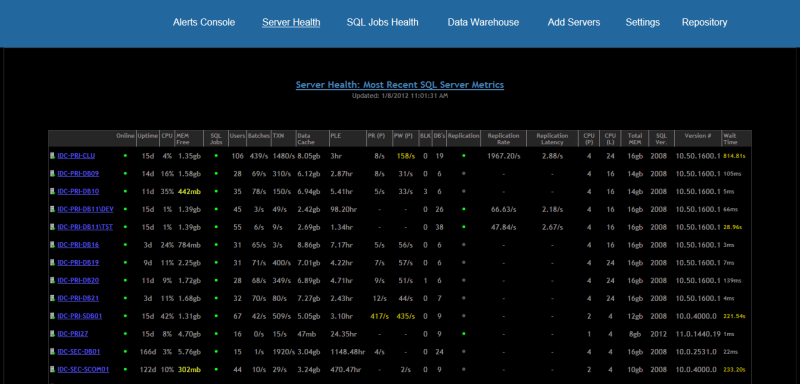
Image 4:
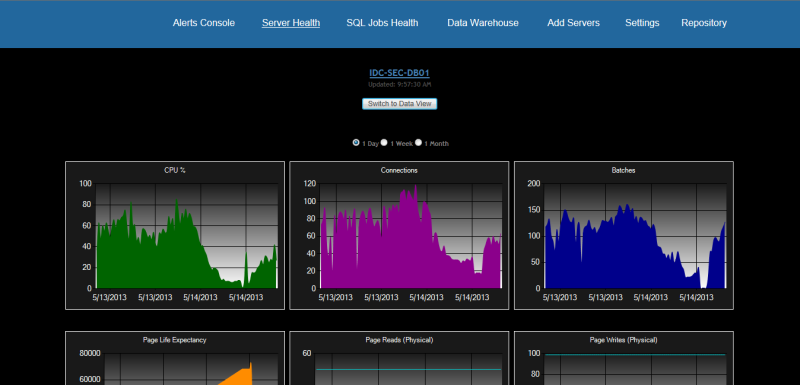
Image 5:
|
|
|
|
|
|