info@techdevops.com
|
437-991-3573
|
Data Engineering Services

|
TechDevOps.com
|
| | | |
|
Experts in Microsoft SQL Server on Windows, Linux, Containers | Clusters, Always On, FCI | Migrations, Cloud, Performance
|
| | | |
|
T-SQL - Constants vs Parameters vs Local Variables - Execution Plans, Statistics, Assumptions
by BFarrell (Principal Consultant; Architecture; Engineering)
2017-04-11
How do T-SQL Constants, Parameters & Local Variables affect the Optimizer's choice for it's Query Execution Plans?
Brief History of Query Execution:
When a stored procedure is created in SQL Server, the query text is saved to system tables. No Execution Plan is created - yet. At this point we are telling SQL Server WHAT data we want and we do not specify HOW to retrieve that data. T-SQL is the WHAT. T-SQL is a declarative language that states what columns data to return. The HOW - to retrieve the data - takes place inside the Query Processor in a step called Query Optimization.
When a stored procedure is first called/executed, this is when the Query Processor, through it's Query Optimization process, creates an Execution Plan for it. The Optimization process has the job of finding the most optimal way to execute each query as quickly as possible. This process generates of a number of candidate plans and it will assign a cost to each. The most optimal / least expensive plan gets passed to the Query Execution engine, which is the component that will actually execute the Execution Plan and get the results from the Storage Engine. (Query Processor - optimize each individual query, output is an Execution Plan, Query Execution Engine - executes the Execution Plan)
With each stored procedure, the query optimization takes place for each query and it is important that it makes wise choices. The search space for a query is the set of all the possible ways to execute it and every possible way will return the same results. Ideally, the Optimizer should generate ALL possible plans that exist in that search space and estimate the cost of each plan. However, this could become VERY time-consuming and create situations where Query Optimization process is taking much longer than Query Execution. Instead, the Optimizer's goal is to balance optimization time and plan quality and choose the most optimal plans.
To set the cost of each query, the Query Optimizer will examine the physical operators and determine a cost based on the needed IO, CPU & Memory. Cost determination calculation also requires the estimated number of records that will need to be processed (called Cardinality Estimation) and this is where SQL Server relies on the Statistics within it's Histograms(distribution of values in columns). Once the cost for each operator is estimated, the Query Optimizer will add up all of these costs to estimate the total cost. This happens for each of the candidate plans. Once every query is optimized, the whole stored procedure is now considered compiled and an Execution Plan is stored in the Procedure Cache where it can potentially be re-used. This re-use of Execution Plans is typically good but there can be some instances where a process called parameter sniffing can cause a performance issue. More on that below. Also, there can exist multiple Execution Plans for a stored procedure depending on the number of parameters or whether the stored procedure does a lot of branching for example. With SSMS, you can execute a stored procedure call and view the actual execution plan used for that call. This Execution Plan will be broken down into queries (Query1, Query2, Query3) and each query has costs associated with each physical operator and there will be a cost for the query relative to all the queries. Tuning involves reducing the costs and also reducing the Estimated Subtree Cost.
It is important to note that each query in the stored procedure is optimized on it's own and the Optimizer does not analyze the flow of execution. Thus, the Optimizer has no knowledge about the run-time values of Variables. It does however know about the stored procedure Parameter values. Let's examine how T-SQL coding with Variables, Constants and Parameters affect the Optimizer and it's decisions.
Query Processing: Stored Procedure call --> Parsing --> Binding --> Query Optimization(per each query) --> Query Execution(per Execution Plan) --> Query Results
Stored Procedures - same results set - but different execution plans:
Clear Procedure Cache: (for testing purposes)
DBCC FREEPROCCACHE
Alter Indexes: (for testing purposes)
ALTER INDEX [PK_LOG_PROCESS] ON [dbo].[LOG_PROCESS] REBUILD PARTITION = ALL WITH (PAD_INDEX = OFF, STATISTICS_NORECOMPUTE = OFF, SORT_IN_TEMPDB = OFF, ONLINE = OFF, ALLOW_ROW_LOCKS = ON, ALLOW_PAGE_LOCKS = ON, FILLFACTOR = 90)
ALTER INDEX [IX_LOG_PROCESS_INSERTEDDATE] ON [dbo].[LOG_PROCESS] REBUILD PARTITION = ALL WITH (PAD_INDEX = OFF, STATISTICS_NORECOMPUTE = OFF, SORT_IN_TEMPDB = OFF, ONLINE = OFF, ALLOW_ROW_LOCKS = ON, ALLOW_PAGE_LOCKS = ON, FILLFACTOR = 90)
Update Stats: (for testing purposes)
sp_updatestats
#1. Constant:
alter proc dbo.a1
as
Select * from LOG_PROCESS where inserteddate > '2017-03-26' --Constant
go
Execution Plan:
Index Seek on IX_LOG_PROCESS_INSERTEDDATE + Key Lookup on PK_LOG_PROCESS
IX_LOG_PROCESS_INSERTEDDATE: Estimated # Rows: 43, Actual # Rows: 7
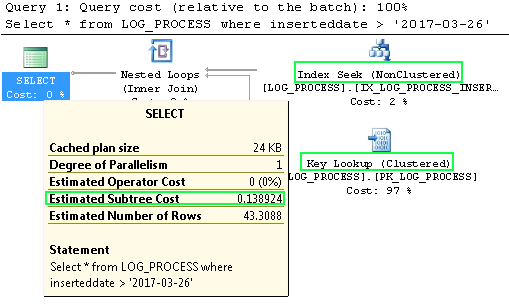
SET STATISTICS IO ON: Table 'LOG_PROCESS'. Scan count 1, logical reads 27, physical reads 0, read-ahead reads 0, lob logical reads 0, lob physical reads 0, lob read-ahead reads 0.
Estimated Subtree Cost: 0.13
#2. Parameter:
alter proc dbo.a2 @dt datetime
as
Select * from LOG_PROCESS where inserteddate > @dt
go
Exec dbo.a2 '2017-03-27'
Execution Plan:
Index Seek on IX_LOG_PROCESS_INSERTEDDATE + Key Lookup on PK_LOG_PROCESS
IX_LOG_PROCESS_INSERTEDDATE: Estimated # Rows: 43, Actual # Rows: 7.
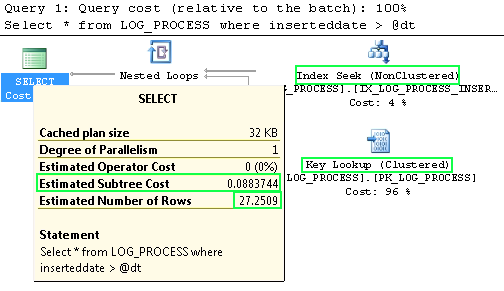
SET STATISTICS IO ON: Table 'LOG_PROCESS'. Scan count 1, logical reads 27, physical reads 0, read-ahead reads 0, lob logical reads 0, lob physical reads 0, lob read-ahead reads 0.
Estimated Subtree Cost: 0.08
During query optimization SQL Server uses the parameter value to come up with an estimate. This is known as parameter sniffing.
Parameter Value --> Estimated # Records --> Execution Plan Operators Chosen. This obviously can be good or bad depending on the distribution of your data. A Histogram analysis is good practice here.
#3. Variable:
alter proc dbo.a3 @dt datetime
as
declare @dt_copy datetime
set @dt_copy = @dt
Select * from LOG_PROCESS where inserteddate > @dt_copy
go
Exec dbo.a3 '2017-03-26'
Execution Plan:
Clustered Index Scan on PK_LOG_PROCESS. Estimated # Rows: 15638, Actual # Rows: 7. Why 15638?
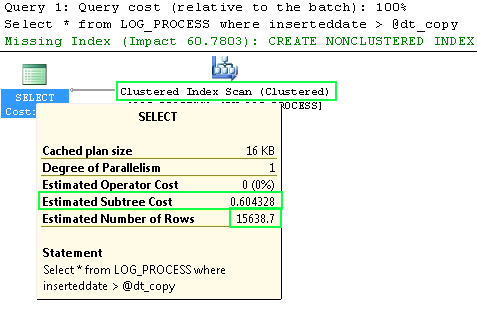
SET STATISTICS IO ON: Table 'LOG_PROCESS'. Scan count 1, logical reads 739, physical reads 0, read-ahead reads 0, lob logical reads 0, lob physical reads 0, lob read-ahead reads 0.
Estimated Subtree Cost: 0.6
During query optimization, SQL Server does not know what any variables values will be. It now has to make assumptions. In the case of an inequality ">", it will estimate 30% records will be returned. 52129(total records) * .30 = 15638. Wait a sec! It is estimating that 30% of the records will be returned when only 1% of the records will actually be returned? Correct!
Since the Query Optimizer uses Estimates and Statistics to build an Execution Plan, it will choose a Clustered Index SCAN since it assumes 30% of the records will be needed. If large # records needed, a Scan would likely be more efficient vs # of Nested Loops required with Index Seek and Key Lookup.
As we can see, a Clustered Index Seek would of been way more efficient since it only needs 7 rows. That a lot less Data Pages to read. Due to the Parameter Value being stored in a Local Variable, this led the Query Optimizer to make a bad decision on Execution Plan choice.
Summary:
The same number of records was returned in all 3 stored procedures.
The first two stored procedure calls had 27 Logical Reads each to service the query. That is 27(Data Pages)*8(KB) = Total KB Read.
The last stored procedure had 739 Logical Reads to service the query. That is 739 * 8. Very inefficient execution plan since it had to look through WAY more Data Pages to get the same number of records. All because the Parameter value was stored in a Variable!
Constants - use the value of the constant to generate an Execution Plan.
Parameters - SQL Server uses/sniffs these values when the stored procedure is called and generates an Execution Plan based off that. Even though it has no idea what those future run-time parameter values will be. (Parameter Sniffing - has pros and cons)
Variables - SQL Server has no knowledge of the run-time value and applies assumptions based on the operator used in T-SQL.
T-SQL to analyze Procedure Cache:
select DB_NAME(dbid) as 'db', objectid, so.name, objtype, cacheobjtype,
usecounts, refcounts, p.size_in_bytes, plan_handle, LEFT([sql].[text], 150) as [text]
from sys.dm_exec_cached_plans p
outer apply sys.dm_exec_sql_text (p.plan_handle) sql
inner join sysobjects so on so.id = sql.objectid
where so.name in ('a1','a2','a3')
ORDER BY usecounts desc
SELECT top 100 cp.objtype AS ObjectType,
OBJECT_NAME(st.objectid,st.dbid) AS ObjectName,
cp.usecounts AS ExecutionCount,
st.TEXT AS QueryText,
qp.query_plan AS QueryPlan
FROM sys.dm_exec_cached_plans AS cp
CROSS APPLY sys.dm_exec_query_plan(cp.plan_handle) AS qp
CROSS APPLY sys.dm_exec_sql_text(cp.plan_handle) AS st
WHERE OBJECT_NAME(st.objectid,st.dbid) in ('a1','a2','a3')
ORDER BY cp.usecounts DESC
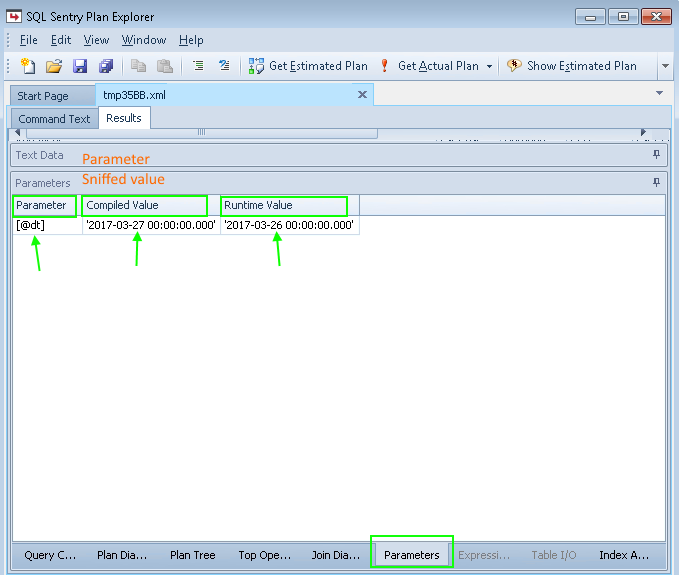
Get the Execution Plan build Parameter-sniffed value: Using ShowPlanXML or Plan Explorer from SQL Sentry
Stored Procedure #2: ShowPlanXML:
ParameterCompiledValue: (this is the parameter sniffed value!!!!!)
<ParameterList>
<ColumnReference Column="@dt" ParameterCompiledValue="'2017-03-27 00:00:00.000'" />
</ParameterList>
***When this Execution Plan is used, it is executed assuming this parameter value is being passed in. It had sniffed that input value when generating the Execution Plan when it was generated in the past. Next, you need to ensure that this value makes sense for all the different possible parameter values being passed in - else it could cause a performance problem for that query.
Compiled Parameter Value vs Run-Time Parameter Values
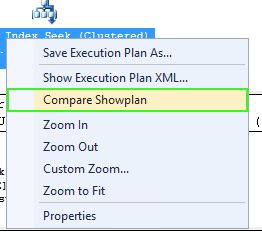
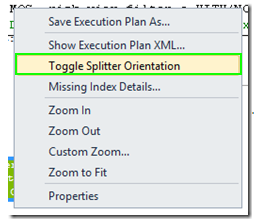
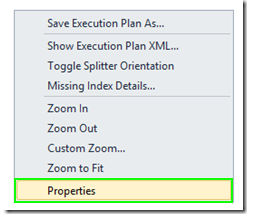
SSMS - Compare Execution Plans - a great tool to compare plans and identify parameter sniffing.
Examples:
1. If different plans exist for a stored procedure - compare & identify differences in both plans.
2. If same plan for a stored procedure, but the sp calls run fast one minute and slow the next - analyze if parameter sniffing has occurred. Use QueryPlanHash to determine if same plan & then use Parameter List to determine if Compiled and Run-time values are different. This can mean a Plan with Nested Loop Operator runs when a Clustered Scan Operator would of been better since the new parameter value led to large amount of records returned for example.
SSMS - Live Execution Plan - an great extremely useful for debugging query performance issues.
To view the live query execution plan, in SSMS, on the tools menu click the Live Query Statistics icon. You can also view access the live query execution plan by right clicking on a selected query in Management Studio and then click Include Live Query Statistics.

Resources:
Comparison Tool released with latest SSMS
|
|
|
|
|
|
|
|
|
|