T-SQL Solution:
How to use this Real-Time Query Profling Process:
- Requires two Query Windows in SSMS (as a test case)
- Execute Step 2 query and leave it running (input SPID)
- Execute Step 1 query and wait for it to complete (get SPID)
- Stop Step 2 query and analyze the results from temp table.
Step #1: In Query Window #1:
--Configure Query for Profiling:
SET STATISTICS PROFILE ON;
GO
SELECT CustomerID, Colchar
FROM dbo.tbl
ORDER BY OrderDate Desc
OPTION (MAXDOP 1, RECOMPILE)
***Make note of the SPID ID from this query session
Step #2: In Query Window #2:
Profile the query executing using the DMV sys.dm_exec_query_profiles:
IF OBJECT_ID('tempdb..#TMP') IS NOT NULL
DROP TABLE #TMP
GO
Create Table #TMP (node_id int, physical_operator_name varchar(150),
percent_complete decimal(18,3), elapsed_time_ms int, cpu_time_ms int,
logical_read_count int, physical_read_count int, write_page_count int,
estimate_row_count int, insertedate datetime)
set nocount on
WHILE(1=1)
BEGIN
WAITFOR DELAY '00:00:00:100'; --CONFIGURE THIS IF NEEDED
INSERT INTO #TMP (node_id, physical_operator_name, percent_complete, elapsed_time_ms, cpu_time_ms,
logical_read_count, physical_read_count, write_page_count, estimate_row_count, insertedate)
SELECT node_id,
physical_operator_name,
CAST(SUM(row_count)*100 AS float) / SUM(estimate_row_count) AS percent_complete,
SUM(elapsed_time_ms) AS elapsed_time_ms,
SUM(cpu_time_ms) AS cpu_time_ms,
SUM(logical_read_count) AS logical_read_count,
SUM(physical_read_count) AS physical_read_count,
SUM(write_page_count) AS write_page_count,
SUM(estimate_row_count) AS estimate_row_count,
getdate()
FROM sys.dm_exec_query_profiles
WHERE session_id = 54 -- spid running query
GROUP BY node_id,
physical_operator_name
ORDER BY node_id;
END
GO
Step #3: In Query Window #2:
Select the profiled data.
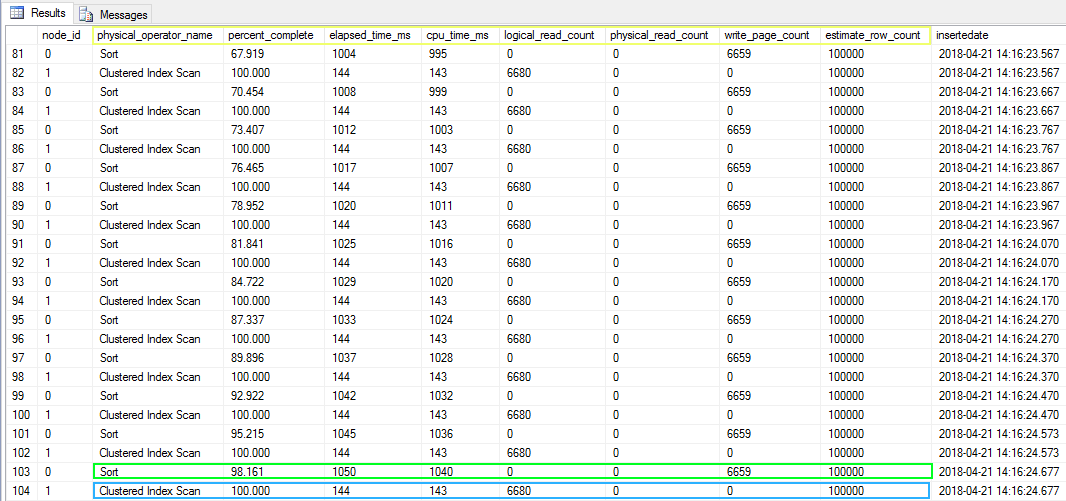
- Examine the Physical Operators and it's Percent_Complete and Elapsed Time, CPU Time, Reads Total, Writes Total and Row Counts. Especially near/at the 100% Complete mark as that is the final cost profile for the query.
- Great tool for helping with query tuning
SELECT * from #TMP ORDER BY insertedate asc, node_id asc;

Resources:
sys.dm_exec_query_profiles (Transact-SQL)
|
|
|
|
|
|