info@techdevops.com
|
437-991-3573
|
Data Engineering Services

|
TechDevOps.com
|
| | | |
|
Experts in Microsoft SQL Server on Windows, Linux, Containers | Clusters, Always On, FCI | Migrations, Cloud, Performance
|
| | | |
|
High CPU Pressure
by BFarrell (Principal Consultant; Architecture; Engineering)
2022-10-08
High CPU Pressure Data Points:
(1) Numerous requests in runnable status are an indication of High CPU Pressure from within the SQL Server process.
(2) Constantly high values for both Context Switches/sec and \Process(sqlservr)\% User Time are an indication of High CPU Pressure caused by the SQL Server process.
(3) In Wait Statistics, if Average Signal Wait Time is high - for example 25 - this means 25% of the time the SQL Server process is waiting for CPU time to become available before it can do work. That is an indication of High CPU Pressure.
A lot of queries that are runnable means they are ready to run but not getting CPU time.
Select
@@SERVERNAME As [Server],
UPPER(Status) As [Request Status],
Count(*) As [Total]
from sys.dm_exec_requests
Where [Status] Not In ('BACKGROUND')
Group By [Status]
Order By [Total] Desc
Heavily loaded schedulers are where more requests(tasks) exist than can be handled by available workers.
Ex. 256 workers are assigned tasks while tasks are waiting for an assignment to a worker.
SELECT
scheduler_id,
status,
cpu_id,
current_workers_count, --Number of workers that are associated with this scheduler. (Includes workers that are not assigned any task)
active_workers_count, --Number of workers that are active. (An active worker must have an associated task and is either running, runnable, or suspended)
current_tasks_count, --Number of current tasks that are associated with scheduler. (Tasks that are currently waiting or running)
runnable_tasks_count, --Number of workers, with tasks assigned to them, that are waiting to be scheduled on the runnable queue
work_queue_count --Number of tasks in the pending queue. (Waiting for a worker to pick them up)
FROM sys.dm_os_schedulers
WHERE
scheduler_id < 255
And status = 'VISIBLE ONLINE'
ORDER BY scheduler_id ASC;
Note: Verify Max Worker Threads Setting.
The max worker threads option configures the number of worker threads that are available, SQL Server wide, to process query requests, login, logout, and similar application requests. Check the max worker threads server option for potentially incorrect settings. Setting the max worker threads option to a small value may prevent enough threads from servicing incoming client requests in a timely manner and could lead to "thread starvation". However, setting the option to a large value can waste address space, because each active thread consumes up to 4 MB on 64-bit servers.
Set the max worker threads option to 0. This enables SQL Server to automatically determine the correct number of active worker threads based on user requests.
If a SQL Server Machine has eight CPUs it can execute eight threads at the same time.
A scheduler manages worker threads that require processing time to carry out work on behalf of tasks.
The time a worker can remain active in a scheduler is called the OS quantum, with a maximum of 4 ms. After its quantum time expires, a worker yields its time to other workers that need to access CPU resources, and changes its state. This cooperation between workers to maximize access to CPU resources is called cooperative scheduling, also known as non-preemptive scheduling. In turn, the change in worker state is propagated to the task associated with that worker, and to the request associated with the task.
In summary, a request may spawn one or more tasks to carry out units of work. Each task is assigned to a worker thread who is responsible for completing the task. Each worker thread must be scheduled (placed on a scheduler) for active execution of the task.
CPU From Queries As Percent of Total CPU Capacity
DECLARE @init_sum_cpu_time int,
@utilizedCpuCount int
--Get CPU count used by SQL Server
SELECT @utilizedCpuCount = COUNT( * )
FROM sys.dm_os_schedulers
WHERE status = 'VISIBLE ONLINE'
--Calculate the CPU usage by queries OVER a 5 sec interval
SELECT @init_sum_cpu_time = SUM(cpu_time)
FROM sys.dm_exec_requests WAITFOR DELAY '00:00:05'SELECT CONVERT(DECIMAL(5,
2),
((SUM(cpu_time) - @init_sum_cpu_time) / (@utilizedCpuCount * 5000.00)) * 100) AS [CPU From Queries As Percent of Total CPU Capacity]
FROM sys.dm_exec_requests
Identify running queries that are responsible for high-CPU *usage*
SELECT TOP 10 s.session_id,
r.status,
r.cpu_time,
r.logical_reads,
r.reads,
r.writes,
r.total_elapsed_time / (1000 * 60) 'Elaps M',
SUBSTRING(st.TEXT, (r.statement_start_offset / 2) + 1,
((CASE r.statement_end_offset
WHEN -1 THEN DATALENGTH(st.TEXT)
ELSE r.statement_end_offset
END - r.statement_start_offset) / 2) + 1) AS statement_text,
COALESCE(QUOTENAME(DB_NAME(st.dbid)) + N'.' + QUOTENAME(OBJECT_SCHEMA_NAME(st.objectid, st.dbid))
+ N'.' + QUOTENAME(OBJECT_NAME(st.objectid, st.dbid)), '') AS command_text,
r.command,
s.login_name,
s.host_name,
s.program_name,
s.last_request_end_time,
s.login_time,
r.open_transaction_count
FROM sys.dm_exec_sessions AS s
JOIN sys.dm_exec_requests AS r ON r.session_id = s.session_id CROSS APPLY sys.Dm_exec_sql_text(r.sql_handle) AS st
WHERE r.session_id != @@SPID
ORDER BY r.cpu_time DESC
Historical CPU-bound queries
SELECT TOP 10 st.text AS batch_text,
SUBSTRING(st.TEXT, (qs.statement_start_offset / 2) + 1, ((CASE qs.statement_end_offset WHEN - 1 THEN DATALENGTH(st.TEXT) ELSE qs.statement_end_offset END - qs.statement_start_offset) / 2) + 1) AS statement_text,
(qs.total_worker_time / 1000) / qs.execution_count AS avg_cpu_time_ms,
(qs.total_elapsed_time / 1000) / qs.execution_count AS avg_elapsed_time_ms,
qs.total_logical_reads / qs.execution_count AS avg_logical_reads,
(qs.total_worker_time / 1000) AS cumulative_cpu_time_all_executions_ms,
(qs.total_elapsed_time / 1000) AS cumulative_elapsed_time_all_executions_ms
FROM sys.dm_exec_query_stats qs
CROSS APPLY sys.dm_exec_sql_text(sql_handle) st
ORDER BY(qs.total_worker_time / qs.execution_count) DESC
Identify queries that cause high CPU usage and that contain at least one missing index in the query plan
SELECT
qs_cpu.total_worker_time / 1000 AS total_cpu_time_ms,
q.[text],
p.query_plan,
qs_cpu.execution_count,
q.dbid,
q.objectid,
q.encrypted AS text_encrypted
FROM
(SELECT TOP 500 qs.plan_handle,
qs.total_worker_time,
qs.execution_count FROM sys.dm_exec_query_stats qs ORDER BY qs.total_worker_time DESC) AS qs_cpu
CROSS APPLY sys.dm_exec_sql_text(plan_handle) AS q
CROSS APPLY sys.dm_exec_query_plan(plan_handle) p
WHERE p.query_plan.exist('declare namespace
qplan = "http://schemas.microsoft.com/sqlserver/2004/07/showplan";
//qplan:MissingIndexes')=1
CPU Pressure insights by analyzing the Wait Statistics (*****)
Wait Statistics are available to inform us in what ways user and system processes are forced to wait. Wait Statistics are, at their highest level, grouped into two main categories: Signal Waits and Resource Waits. A Signal Wait is recorded by processes running on SQL Server and waiting for a CPU to become available (so-called because the process has “signaled” it’s ready for time on the CPU). A Resource Wait is recorded by processes running on SQL Server and waiting for a specific resource to become available (i.e. waiting for the release of a lock on a specific record)
Whenever a Thread needs a resource it can’t immediately acquire, it becomes suspended. Next, waits on the Waiter List are told (signaled) their resource is available. The time spent on the Waiter List is the Resource Wait Time and the time spent on the Runnable Queue is the Signal Wait Time. Together, they combine to be the overall wait time. SQLOS records the wait time and the signal wait time, so we have to do some calculations on sys.dm_os_wait_stats to derive the resource wait time.
The Waiter List is unordered (any thread on it can be signaled at any time and move to the Runnable Queue), and the Runnable Queue is first-in, first-out (FIFO) almost 100% of the time.
One reason why a Thread may need to move off the Processor is it has exhausted it's Quantum. Thread Quantum in SQLOS is fixed at 4ms. The Thread itself is responsible for determining its quantum has been exhausted (by calling helper routines in SQLOS) and voluntarily giving up the processor (known as yielding). When this occurs, the Thread moves directly to the bottom of the Runnable Queue, as there’s nothing for it to wait for. SQLOS must record a wait type for this transition of the Processor, though, and records SOS_SCHEDULER_YIELD. This cycle goes on till the thread finishes the work. (Running to Runnable to Running allowing other Tasks to get CPU time as well - as long as it only needs the CPU). This is often mistaken for CPU pressure, but it’s not - it’s just sustained CPU usage. CPU pressure, and recognizing it, is a whole different item. A data point to analyze for determining whether there is CPU Pressure is Wait Statistics Signal Wait Time. If the average signal wait time is low (0–0.1 – 0.2 ms), it is likely that CPU pressure is not an issue. IF that Signal Wait Time was 25 for example. This means 25% of the time the SQL Server process is waiting for CPU time to become available before it can do work!!!!! That is CPU pressure. That is a problem. Use the script below to check.
Note:
When SOS_SCHEDULER_YIELD is the most prevalent on a server, it’s common to see sustained, high CPU usage.
There are two main causes for SOS_SCHEDULER_YIELD:
(1) A Thread exhausting its scheduling quantum
(2) A Thread failing to acquire a spinlock.
Heavily recurring instances of either cause can lead to SOS_SCHEDULER_YIELD being the most common wait, along with high CPU usage.
In 99.9999% of the cases, Thread Exhaustion is what’s happening. It’s extremely rare for a spinlock to be the cause of high CPU and high SOS_SCHEDULER_YIELD.
A spinlock is a low-level synchronization primitive used to provide thread-safe access to data structures in SQL Server. If the spinlock can’t be acquired, the thread immediately tries to acquire it again and again and again for up to a thousand iterations. It does this until it backs off and goes to the bottom of the Runnable Queue, recording an SOS_SCHEDULER_YIELD wait also.
In the case of Thread Quantum Exhaustion, it isn’t the underlying root cause. It’s a further symptom. Now, we need to consider why a thread may be exhausting its quantum repeatedly.
A Thread can only exhaust its quantum when it can continue processing SQL Server code for four milliseconds without needing a resource another thread owns—no waiting for locks, page latches, data file pages to be read from disk, memory allocations, file growths, logging, or the myriad other resources a thread might need. When the thread quantum expires, the thread must yield the processor. It has no knowledge of other threads on that scheduler and there is always a context switch when the thread goes to the bottom of the runnable queue.
The most common root cause where quantum exhaustion can occur and accumulate large amounts of SOS_SCHEDULER_YIELD waits is scanning an index/table where all the necessary data file’s pages are in memory and there’s no contention for access to those pages. Best to look for in query plans when you see SOS_SCHEDULER_YIELD as the top wait type—large and/or repeated index/table scans. (i.e. Missing Index, Stale Statistics, SARGability Issues, Inefficient Parameter Sniffing, Inefficient Plan Chosen)
- Applying any function or computation on the column(s) in the search predicate generally makes the query non-sargable and leads to higher CPU consumption. Solutions typically involve rewriting the queries in a creative way to make the SARGable.
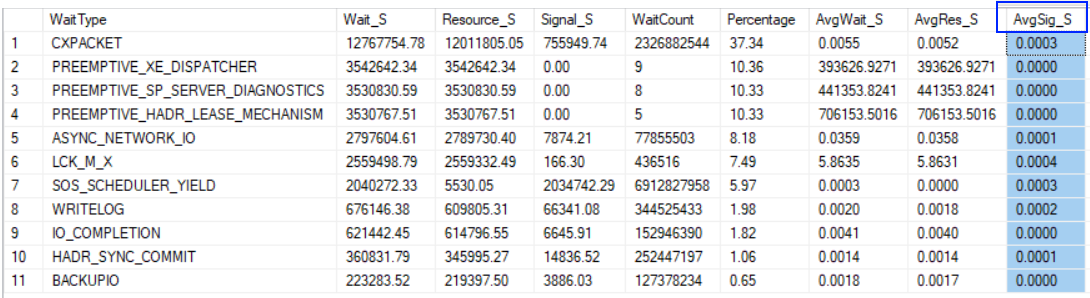
--Key Wait Statistics: (Output: Image #1:)
;WITH [Waits] AS
(SELECT
[wait_type],
[wait_time_ms] / 1000.0 AS [WaitS],
([wait_time_ms] - [signal_wait_time_ms]) / 1000.0 AS [ResourceS],
[signal_wait_time_ms] / 1000.0 AS [SignalS],
[waiting_tasks_count] AS [WaitCount],
100.0 * [wait_time_ms] / SUM ([wait_time_ms]) OVER() AS [Percentage],
ROW_NUMBER() OVER(ORDER BY [wait_time_ms] DESC) AS [RowNum]
FROM sys.dm_os_wait_stats
WHERE [wait_type] NOT IN (
-- These wait types are almost 100% never a problem and so they are
-- filtered out to avoid them skewing the results.
N'BROKER_EVENTHANDLER',
N'BROKER_RECEIVE_WAITFOR',
N'BROKER_TASK_STOP',
N'BROKER_TO_FLUSH',
N'BROKER_TRANSMITTER',
N'CHECKPOINT_QUEUE',
N'CHKPT',
N'CLR_AUTO_EVENT',
N'CLR_MANUAL_EVENT',
N'CLR_SEMAPHORE',
-- Maybe comment this out if you have parallelism issues
N'CXCONSUMER',
-- Maybe comment these four out if you have mirroring issues
N'DBMIRROR_DBM_EVENT',
N'DBMIRROR_EVENTS_QUEUE',
N'DBMIRROR_WORKER_QUEUE',
N'DBMIRRORING_CMD',
N'DIRTY_PAGE_POLL',
N'DISPATCHER_QUEUE_SEMAPHORE',
N'EXECSYNC',
N'FSAGENT',
N'FT_IFTS_SCHEDULER_IDLE_WAIT',
N'FT_IFTSHC_MUTEX',
-- Maybe comment these six out if you have AG issues
N'HADR_CLUSAPI_CALL',
N'HADR_FILESTREAM_IOMGR_IOCOMPLETION',
N'HADR_LOGCAPTURE_WAIT',
N'HADR_NOTIFICATION_DEQUEUE',
N'HADR_TIMER_TASK',
N'HADR_WORK_QUEUE',
N'KSOURCE_WAKEUP',
N'LAZYWRITER_SLEEP',
N'LOGMGR_QUEUE',
N'MEMORY_ALLOCATION_EXT', -
N'ONDEMAND_TASK_QUEUE',
N'PARALLEL_REDO_DRAIN_WORKER',
N'PARALLEL_REDO_LOG_CACHE',
N'PARALLEL_REDO_TRAN_LIST',
N'PARALLEL_REDO_WORKER_SYNC',
N'PARALLEL_REDO_WORKER_WAIT_WORK',
N'PREEMPTIVE_OS_FLUSHFILEBUFFERS',
N'PREEMPTIVE_XE_GETTARGETSTATE',
N'PVS_PREALLOCATE',
N'PWAIT_ALL_COMPONENTS_INITIALIZED',
N'PWAIT_DIRECTLOGCONSUMER_GETNEXT',
N'PWAIT_EXTENSIBILITY_CLEANUP_TASK',
N'QDS_PERSIST_TASK_MAIN_LOOP_SLEEP',
N'QDS_ASYNC_QUEUE',
N'QDS_CLEANUP_STALE_QUERIES_TASK_MAIN_LOOP_SLEEP',
N'QDS_SHUTDOWN_QUEUE',
N'REDO_THREAD_PENDING_WORK',
N'REQUEST_FOR_DEADLOCK_SEARCH',
N'RESOURCE_QUEUE',
N'SERVER_IDLE_CHECK',
N'SLEEP_BPOOL_FLUSH',
N'SLEEP_DBSTARTUP',
N'SLEEP_DCOMSTARTUP',
N'SLEEP_MASTERDBREADY',
N'SLEEP_MASTERMDREADY',
N'SLEEP_MASTERUPGRADED',
N'SLEEP_MSDBSTARTUP',
N'SLEEP_SYSTEMTASK',
N'SLEEP_TASK',
N'SLEEP_TEMPDBSTARTUP',
N'SNI_HTTP_ACCEPT',
N'SOS_WORK_DISPATCHER',
N'SP_SERVER_DIAGNOSTICS_SLEEP',
N'SQLTRACE_BUFFER_FLUSH',
N'SQLTRACE_INCREMENTAL_FLUSH_SLEEP',
N'SQLTRACE_WAIT_ENTRIES',
N'VDI_CLIENT_OTHER',
N'WAIT_FOR_RESULTS',
N'WAITFOR',
N'WAITFOR_TASKSHUTDOWN',
N'WAIT_XTP_RECOVERY',
N'WAIT_XTP_HOST_WAIT',
N'WAIT_XTP_OFFLINE_CKPT_NEW_LOG',
N'WAIT_XTP_CKPT_CLOSE',
N'XE_DISPATCHER_JOIN',
N'XE_DISPATCHER_WAIT',
N'XE_TIMER_EVENT'
)
AND [waiting_tasks_count] > 0
)
SELECT
MAX ([W1].[wait_type]) AS [WaitType],
CAST (MAX ([W1].[WaitS]) AS DECIMAL (16,2)) AS [Wait_S],
CAST (MAX ([W1].[ResourceS]) AS DECIMAL (16,2)) AS [Resource_S],
CAST (MAX ([W1].[SignalS]) AS DECIMAL (16,2)) AS [Signal_S],
MAX ([W1].[WaitCount]) AS [WaitCount],
CAST (MAX ([W1].[Percentage]) AS DECIMAL (5,2)) AS [Percentage],
CAST ((MAX ([W1].[WaitS]) / MAX ([W1].[WaitCount])) AS DECIMAL (16,4)) AS [AvgWait_S],
CAST ((MAX ([W1].[ResourceS]) / MAX ([W1].[WaitCount])) AS DECIMAL (16,4)) AS [AvgRes_S],
CAST ((MAX ([W1].[SignalS]) / MAX ([W1].[WaitCount])) AS DECIMAL (16,4)) AS [AvgSig_S],
CAST ('https://www.sqlskills.com/help/waits/' + MAX ([W1].[wait_type]) as XML) AS [Help/Info URL]
FROM [Waits] AS [W1]
INNER JOIN [Waits] AS [W2] ON [W2].[RowNum] <= [W1].[RowNum]
GROUP BY [W1].[RowNum]
HAVING SUM ([W2].[Percentage]) - MAX( [W1].[Percentage] ) < 95; -- percentage threshold
GO
--Overall Wait Statistics:
SELECT SUM(signal_wait_time_ms) AS TotalSignalWaitTime ,
( SUM(CAST(signal_wait_time_ms AS NUMERIC(20, 2)))
/ SUM(CAST(wait_time_ms AS NUMERIC(20, 2))) * 100 ) AS PercentageSignalWaitsOfTotalTime
FROM sys.dm_os_wait_stats
--Verifying CPU Pressure via signal wait time
--Confirm the data:
Querying against the Dynamic Management Views of SQL Server means querying against data that is collected from the last SQL Server Instance restarted. Unless you clear the cache:
DBCC SQLPERF (N'sys.dm_os_wait_stats', CLEAR);
...which you might do to ensure that you get an isolated set of data from a special given starting point.
...ideally pick a workload and before running it, clear the wait stats.
...repeat 2-3 times
--How to fix CPU Pressure:
- Add More CPU's
- Add Faster CPU's
- Reduce the workload on the CPU via finding the top queries based on CPU Usage (i.e. Sort operations are CPU expensive, Hash Joins are CPU expensive, Missing Indexes, Index Fragmentation, Stale Statistics, Parameter Sniffing, Re-write code to reduce Logical Reads, Separate Read Workloads to another node)
Image #1:
|
|
|
|
|
|
|
|
|
|