Get-ClusterLog
Windows Server 2012+
Run Windows Powershell (Open as Administrator)
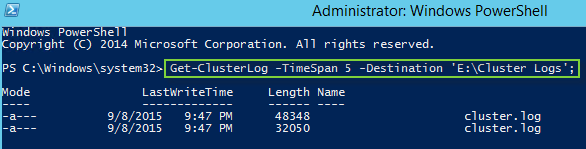
Get-ClusterLog –UseLocalTime -TimeSpan 5 -Destination 'E:\Cluster Logs';
- TimeSpan 5 (logs cover the last 5 minutes)
- The event log is in local time and the cluster.log is in GMT. With Windows Server 2012+ you can use the Get-ClusterLog –UseLocalTime to generate the Cluster.log in local time. This will make correlating with the event log easier.
Get-ClusterResource
Get-ClusterResource -Name "SQL Server" | Format-List -Property *
Test-Cluster –Node Node1,Node2
Test-Cluster –list
Get-ClusterLog
- If only run Get-ClusterLog cmdlet, then go to the C:\Windows\Cluster\Reports folder and open the Cluster.log file
- If ever Cluster issues, search cluster log for entries regarding “IsAlive” and/or “LooksAlive”.
- For example, if SQL Server does not respond to the LooksAlive request, it will lead to a restart of the resource - but we won’t know why it was unresponsive. Usually, it is due to performance, but in order to know for sure, we would have to capture performance data the next time the issue occurs.
ClusterLogLevel = 5
Note: The default verbosity level for the cluster log is 3. This proves to be sufficient for most debugging purposes. However, if this verbosity level is not capturing the data you need, you can increase the verbosity level . On a Windows PowerShell® console run:
(Get-Cluster).ClusterLogLevel = 5
This generates significant logging so the default level should be restored once the troubleshooting is completed.
The cluster log can be generated in local time using Failover Clustering Windows PowerShell®:
Get-ClusterLog -UseLocalTime
How to Troubleshoot Create Cluster Failures
Analyze:
C:\Windows\Cluster\Reports\CreateCluster.hmt
Analyze:
Turn on Cluster API Debug Tracing
If you are unable to pinpoint the root cause of the failure by neither the Validate report nor the Create Cluster log, then verbose debug logging can be enabled. Debug tracing can be turned on:
1. Open Event Viewer
2. Click View then “ Show Analytic and Debug Logs ”
3. Browse down to Applications and Services Logs \ Microsoft \ Windows \ FailoverClustering-Client \ Diagnostic
4. Right-click on Diagnostic and select “ Enable Log ”
5. Create a cluster
6. Right-click on Diagnostic and select “ Disable Log ”
Note: The debug tracing will be generated to the Diagnostic channel and viewable only after you disable logging.
Left-click on Diagnostic to view the logging captured.
Note: The number one reason for create cluster failures is due to misconfigured permissions in Active Directory environments resulting in failures while creating the Cluster Name Object (CNO)
1. On the Domain Controller launch the Active Directory Users and Computers
2. On the View menu, make sure that Advanced Features is selected
3. Navigate to the OU you are trying to create your Cluster Name Object (CNO) in. By default this will the same OU as that of the node you are trying to create a cluster from.
4. Right-click on the OU and select Properties and then the Security tab.
5. Ensure that the Cluster Administrator has Create all child objects permissions
6. Select the Advanced tab
7. Click Add , type the name of the cluster administrator account for the Principal
8. In the Permission container dialog box, locate the Create Computer objects and Read All Properties permissions, and make sure that the Allow check box is selected for each one.
|
|
|
|
|
|