Use these as tools in query tuning to speed up searching for records in Tables (Heaps, Clustered Indexes, Non-clustered Indexes),
for examining a column's data values uniqueness/density/selectivity, for help in determining whether an index is useful or not and
for achieving faster queries.
Data <--> Indexes <--> Statistics <--> Query Optimizer <--> Execution Plan --> Query Results
Tools:
SET STATISTICS IO ON
MSDN: "Causes SQL Server to display information regarding the amount of disk activity generated by Transact-SQL statements."
Key Metrics:
1. Scan Count - Number of seeks/scans started after reaching the leaf level in any direction to retrieve all the values to construct
the final data set. If a high number, it indicates the Optimizer has chosen a plan that caused this object to be read repeatedly.
2. Logical Reads - Number of pages read from the data cache.
- Logical reads are # of 8k pages read from buffer cache (MEM) to service the query.
- Logical reads total includes Physical Reads also.
3. Physical Reads - Number of 8k pages read from disk & placed into buffer cache.
4. Read-Ahead Reads - Number of pages placed into the cache for the query.
Goal: Reduce Logical Reads as much as possible.
SET STATISTICS TIME ON
MSDN: "Displays the number of milliseconds required to parse, compile, and execute each statement."
SQL Server Parse and Compile is the time spent to prepare/create of a compiled plan. (parse & compile - check for syntax errors)
If the CPU time & Elapsed time are 0 in SQL Server Parse and Compile, it indicates that SQL server did not spend any time in parsing
and compiling the query b/c the execution plan was found in the query/plan cache.
CPU time refers to the actual time in milliseconds spent on CPU.
Elapsed time refers to the total time taken for the completion of the parse and compile.
Elapsed time includes wait time in the CPU queue or IO wait.
SQL Server Execution Time is the time to complete the execution of the compiled plan.
CPU time refers to the actual time in milliseconds spent on CPU.
Elapsed time is the total time to complete the execution which includes signal wait time, wait time to complete the IO operation
and time taken to transfer the output to the client.
Goal: Reduce the CPU time as much as possible as this value typically does not vary much between subsequent executions.
Notes:
CPU Time:
- If an Execution Plan goes Parallel, CPU time can be more that Elapsed Time as CPU Time will include time spent across all CPU's.
SET STATISTICS PROFILE ON
MSDN: "When STATISTICS PROFILE is ON, each executed query returns its regular result set, followed by an additional result set that shows a profile of the query execution."
i.e. If have a 3000 line stored procedure and, based on parameters passed in, only 3 statements get executed - this is what Statistics Profile will display.
View each physical plan operator in the tree & per-operator row counts.
Statistics Profile is used to identify issues with a plan which can cause the plan to perform poorly.
It can help identify a poor index choices.
It can help identity poor join order in a plan.
It can help identify a needed solution, such as updating statistics (as in the Histograms and other statistical information used during
Execution Plan selection/creation) or perhaps the need to a plan hint.
Key Metrics:
#1. Rows
#2. Executes - number of invocations of this operator.
#3. StmtText - *copy this and place in SSMS for viewing. Compare to the statistics profile details.
#4. Estimated Rows
#5. Physical Operator
Estimated cardinality:
Each operator in a query plan has an estimated cardinality - the number of rows the optimizer guesses, based on Statistics, that the operator
would return, and an actual cardinality which is the the number of rows that the operator actually returned when executed.
The Query Optimizer can inaccurately guess/predict the number of rows that a given operator will return. This can prevent SQL Server
from estimating the cost of a query plan correctly and this lead to to the selection of a sub-optimal plan. Cardinality estimation issues
are one of the common causes of slow query plans in SQL Server. Thus it is important to identify Cardinality estimation problems inside a query plan.
Goal: Ensure there are no Cardinality issues where Rows and Estimated Rows are not similar.
Set Statistics XML ON
MSDN: "Causes Microsoft SQL Server to execute Transact-SQL statements and generate detailed information about how the statements were executed in the form of a well-defined XML document."
Key Metrics:
1. StatementEstRows - the number of rows that have been estimated to be returned by the plan.
2. StatementOptmLevel - whether the plan that is trivial or full. A trivial plan occurs when the Optimizer determines only one plan will ever be optimal.
3. RetrievedFromCache
4. StatementSubTreeCost - The total calculated cost for all of the operations in the statement.
DBCC SHOW_STATISTICS
MSDN: "DBCC SHOW_STATISTICS displays current query optimization statistics for a table or indexed view. The query optimizer uses statistics to estimate the cardinality or number of rows in the query result, which enables the query optimizer to create a high quality query plan. For example, the query optimizer could use cardinality estimates to choose the index seek operator instead of the index scan operator in the query plan, improving query performance by avoiding a resource-intensive index scan.
The query optimizer stores statistics for a table or indexed view in a statistics object. For a table, the statistics object is created on either an index or a list of table columns. The statistics object includes a header with metadata about the statistics, a histogram with the distribution of values in the first key column of the statistics object, and a density vector to measure cross-column correlation. The Database Engine can compute cardinality estimates with any of the data in the statistics object.
DBCC SHOW_STATISTICS displays the header, histogram, and density vector based on data stored in the statistics object. The syntax lets you specify a table or indexed view along with a target index name, statistics name, or column name. This topic describes how to display the statistics and how to understand the displayed results."
Key Metrics:
#1. All Density: Density is calculated as 1 / number distinct values.
A measure of the uniqueness of the data in a column. High density means less unique data. Density values range from 0 to 1.0.
#2. Updated - Date and time the statistics were last updated.
#3. Rows - Total number of rows in the table or indexed view when the statistics were last updated. If the statistics are filtered or correspond to a filtered index, the number of rows might be less than the number of rows in the table.
#4. Rows Sampled - Total number of rows sampled for statistics calculations. If Rows Sampled < Rows, the displayed histogram and density results are estimates based on the sampled rows.
Goals:
Updated is a recent date to ensure Statistics are updated which the Query Optimizer uses for Execution Plan selection & creation.
- Update the Stats if the Updated field value is not recent
Notes:
Selectivity is also a measure of uniqueness. High selectivity implies high uniqueness. Selectivity is most commonly used to describe
a predicate.
Each histogram step summarizes the density of all rows in the table that have a value that is equal to or less than that row's RANGE_HI_KEY value, but greater than the RANGE_HI_KEY of the preceding histogram step.
The optimizer often uses the histogram steps in column statistics to estimate the selectivity of a predicate.
The estimated selectivity of a predicate is essential when the optimizer is evaluating possible plans. It will affect things like join order (all other things equal, the most selective join operation is generally performed first) and whether SQL chooses to do a table scan or an index seek followed by a bookmark lookup. The optimizer often uses the histogram steps in column statistics to estimate the selectivity of a predicate.
SQLSentry Plan Explorer
- Plan Explorer builds upon the graphical plan view in SQL Server Management Studio (SSMS) to make query plan optimization more efficient
- Free Download
Key Features:
1. Top Operators
2. Plan Tree
3. Plan Diagram - Line Widths by Data Size
4. Plan Diagram - Costs By - IO or CPU or CPU + IO
Demo:
#1. Create a table with 3 columns
col1 has all unique values. col2 has some unique calues. col3 has 1 unique value.
Create Table dbo.tbl (col1 int not null, col2 int, col3 int)
insert into tbl select 1,1,1
insert into tbl select 2,1,1
insert into tbl select 3,1,1
insert into tbl select 4,2,1
insert into tbl select 5,3,1
insert into tbl select 6,3,1
insert into tbl select 7,3,1
insert into tbl select 8,3,1
insert into tbl select 9,3,1
insert into tbl select 10,4,1
#2. Create a Primary Key Clustered Index on col1
ALTER TABLE [ResCloud].[dbo].[tbl] ADD CONSTRAINT [PK_CI_tbl_col1] PRIMARY KEY CLUSTERED
(
[col1] ASC
) WITH (FILLFACTOR = 90);
#3. Execute sp_updatestats
#4. Examine Statistics
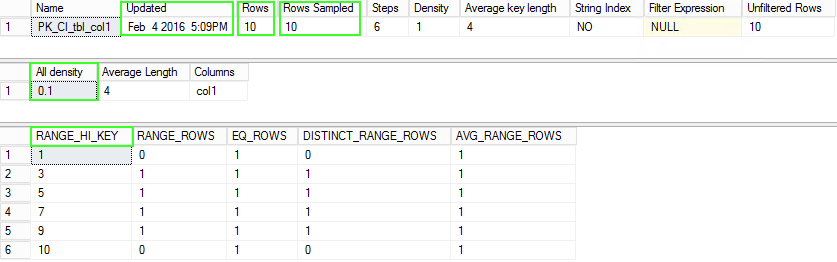
Check the statistics on col1 which is the Primary Key column:
DBCC Show_Statistics ("dbo.tbl", "PK_CI_tbl_col1") --WITH STAT_HEADER
As seen in the image below, the density output seen via "All Density" = 0.1 (1/10 is 1 divided by # distinct/unique values)
Image #1:
Create Statistics manually on col2 and col3:
Create Statistics stats_tbl_c2 on dbo.tbl (col2) with fullscan
Create Statistics stats_tbl_c3 on dbo.tbl (col3) with fullscan
Check the statistics on col2:
DBCC Show_Statistics ("dbo.tbl", "stats_tbl_c2")
Density Output: All Density = 0.25 which is 1/4 (since 4 unique values for col2)
Check the statistics on col3:
DBCC Show_Statistics ("dbo.tbl", "stats_tbl_c3")
Density Output: All Density = 1 which indicates there is 1 unique value in col3 for all records. All duplicate values. Thus Selectivity is very
low meaning this data is not a good candidate for an Index. The B-Tree would have all duplicate values for col3.
Range_HI_Key: (Histogram)
- The Optimizer uses this data to estimate selectivity. The values in the histogram are examined.
Confirm Current Statistics:
SELECT name AS stats_name, STATS_DATE(object_id, stats_id) AS statistics_update_date
FROM sys.stats WHERE object_id = OBJECT_ID('[dbo].[tbl]');
Drop Table dbo.tbl
Ex. Very high Uniqueness of values / Low density / High Selectivity
Confirm Current Statistics:
SELECT name AS stats_name, STATS_DATE(object_id, stats_id) AS statistics_update_date
FROM sys.stats WHERE object_id = OBJECT_ID('[dbo].[Search_List]');
DBCC Show_Statistics ("dbo.Search_List", "PK_SEARCH_LIST") --WITH STAT_HEADER
(PK_SEARCH_LIST is on ListID column)
All Density = 3.299415E-06 (6 decimal points to the left)
= 0.0000032 (Very unique values)
Resources:
DBCC SHOW_STATISTICS (Transact-SQL)
Query Tuning Fundamentals: Density, Predicates, Selectivity, and Cardinality
sys.stats (Transact-SQL)
|
|
|
|
|
|