SQL Server Management Studio - Include Client Statistics:
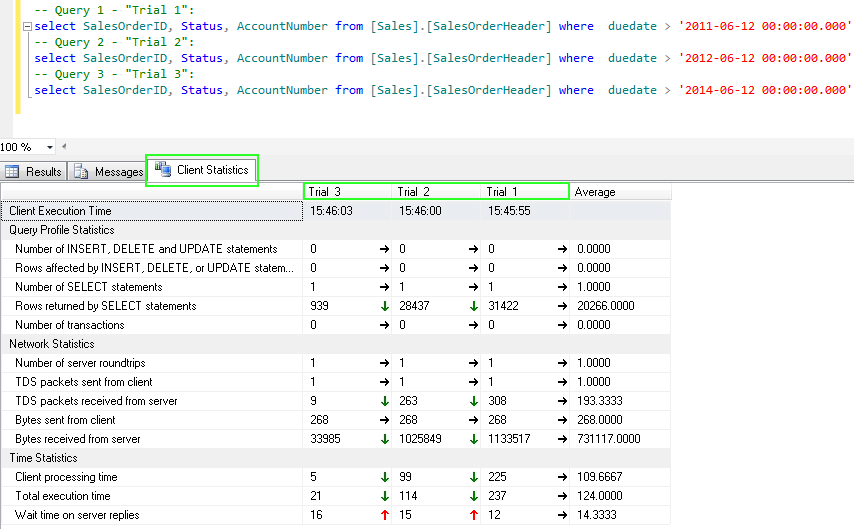
When you run a T-SQL query in the Transact-SQL Editor, you can choose to collect Client Statistics. This includes statistics for
Query Profile, Network & Time. Each category has subcategories with specific metrics collected.
If you enable Client Statistics - via the Query Menu or Toolbar "Include Client Statistics" - the "Statistics" tab appears next to the "Message"
tab upon query execution.
This is a great tool for measuring changes to a query over subsequent executions. Statistics from the last 10 successive query executions
are displayed along with the average values. It is very useful for measuring how much data is retrieved from Server to Client side. For example
it may be the case that Query Cost is low but the data size returned is large - which can affect Total Query duration time.
I typically use this "Client-to-Server" Tool along with Execution Plans, Set Statistics IO & Set Statistics Time when optimizing T-SQL queries.
The Client Statistics are really useful if you want to measure round-trip related statistics. i.e. From the Client to the Server and back to the Client.
Actual Query Cost performance on SQL Server engine is measured using Execution Plans, Set Statistics IO & Set Statistics Time.
|
|
|
|
|
|