info@techdevops.com
|
437-991-3573
|
Data Engineering Services

|
TechDevOps.com
|
| | | |
|
Experts in Microsoft SQL Server on Windows, Linux, Containers | Clusters, Always On, FCI | Migrations, Cloud, Performance
|
| | | |
|
SQL Server - File IO - Sizes, Usage, Stats - Write(Insert) vs Read(Select)
by BFarrell (Principal Consultant; Architecture; Engineering)
2017-03-30
SQL Server's Databases(User, TempDB) Data & Log File IO is an important item to monitor, log, baseline & alert on because it can have a huge contribution to Server and Application performance. A Server being able to perform IOs(Write File, Read File) quickly is a key component in the success of any implementation. This is even more essential when you factor in that the majority of today's SQL Server systems are I/O bound.
If the I/O Subsystem cannot keep up with the demand being placed on it, then the SQL Server workload will have performance problems. Always ensure that the Application / SQL Server Workload IO demands are met with an IO Subsystem that can serve it. For example, if SQL Server is pushing 1000 IOPS and the IO Subsystem can only handle 500 IOPS, disk queuing + IO Latency are going to occur. (If SQL Server is not pushing many IOPS then the type of Disk Drives can be lowered and that often happens with SAN Drive Types and Auto-Tiering.)
In many cases, the initial design of the SQL Server Workload & IO Subsystem are sufficient. BUT, overtime the SQL Server's Workload can increase and issues may appear. Anytime your Database Code or Query Plans or Indexes or Statistics or MANY others internal SQL Server factors CHANGE, it is important to know about those and analyze if SQL Server's Workload is NOW too high for the IO Subsystem to NOW handle that - IO Demand > IO capability. However, the same holds true when SQL Server's Workload has not changed and the IO Subsystem is not responding as it was in the past. Here you can compare your past IO response times & throughput to today's IO response times & throughput using Tools like Diskspd Utility from Microsoft.
In this post, we will analyze the effect of doing Many/Smaller Transactions vs batching into a Single/Large Transaction can be seen in the resultant query time. i.e. Issuing Insert Command 1000s times implicitly or wrapping 1000s Inserts in a single explicit transaction. The activity generated by SQL Server on the IO Subsystem can vary greatly. You will see the IO size change with Insert batching. We also take a comparative look at Select command and how the IO Size varies with it as it gets the Data Pages from disk during physical/read IOs.
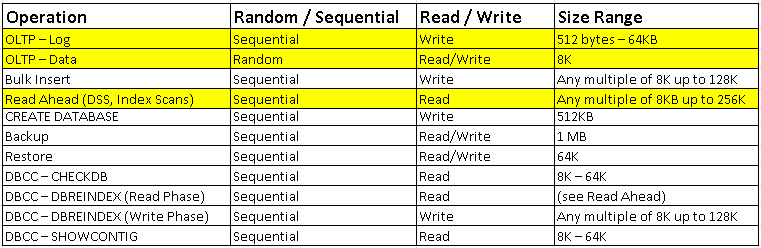
Characteristics for most general types of SQL Server IO are given in the below table:
WRITE IOs to DB Log File:
Testing Transaction Size - Many/Smaller Implicit vs One/Large Explicit - effects on IO Size(Writes) to LDF & Query Time.
Use Case table:
CREATE TABLE [dbo].[Clients](
[ClientID] [int] NOT NULL,
CONSTRAINT [PK_Numbers] PRIMARY KEY CLUSTERED
(
[ClientID] ASC
)WITH (PAD_INDEX = OFF, STATISTICS_NORECOMPUTE = OFF, IGNORE_DUP_KEY = OFF, ALLOW_ROW_LOCKS = ON, ALLOW_PAGE_LOCKS = ON) ON [PRIMARY]
) ON [PRIMARY]
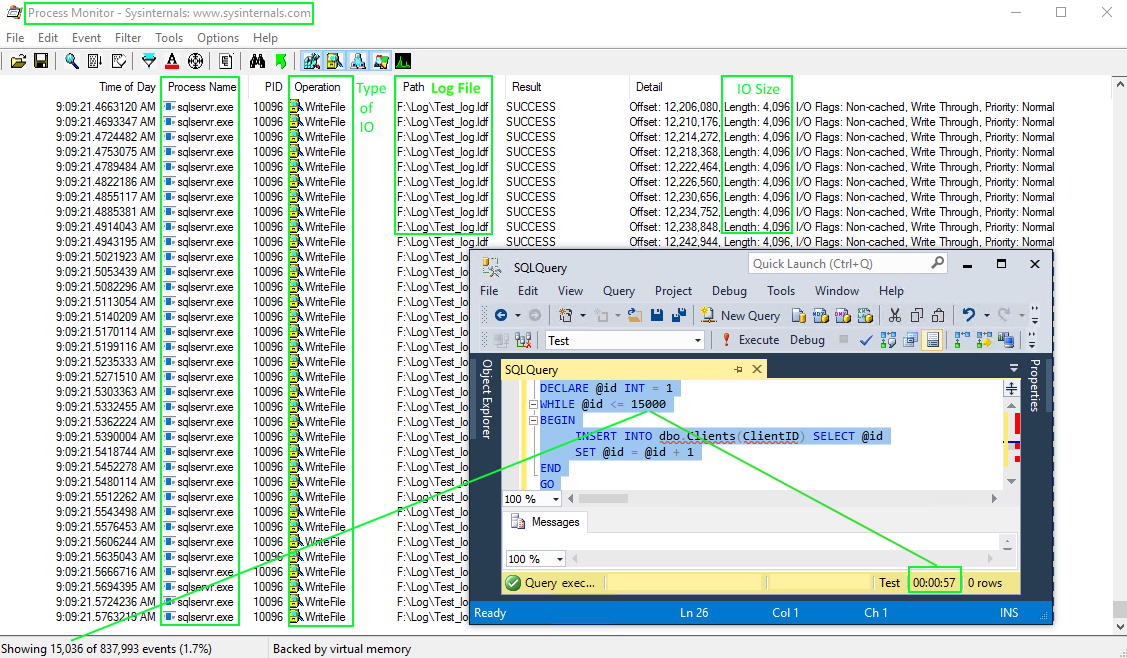
Case #1 - Implicit Transactions
DECLARE @id INT = 1
WHILE @id <= 15000
BEGIN
INSERT INTO dbo.Clients(ClientID) SELECT @id
SET @id = @id + 1
END
Result:
- 15000 Separate, Implicit Transactions occur (Implicit Transactions auto-commit. This requires the row be flushed to the transaction log.)
- 15000 Separate IOs(Writes) to the Database Transaction Log File occur
- IO Size is 4096 bytes for each of the 15000 separate IOs
- Query Time is 60 seconds
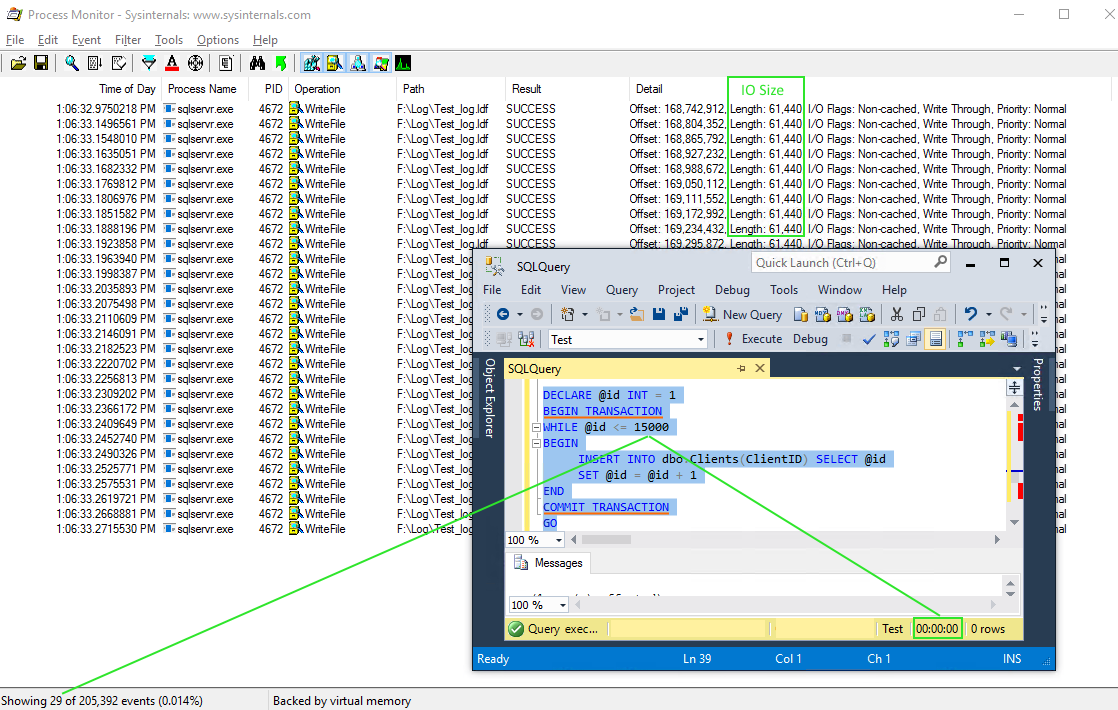
Case #2 - Explicit Transaction
DECLARE @id INT = 1
BEGIN TRANSACTION
WHILE @id <= 15000
BEGIN
INSERT INTO dbo.Clients(ClientID) SELECT @id
SET @id = @id + 1
END
COMMIT TRANSACTION
Result:
- 1 Explicit Transaction occurs
- 29 Separate IOs(Writes) to the Database Transaction Log File occur
- IO Size is 61,440 bytes for each of the 29 separate IOs
- Query Time is < 1 second !!!
Summary:
In Case #2, SQL Server is able to combine way more Log Records(Log Buffer(MEM)) with each separate IO(Write) to the Transaction Log File(Disk).
The IO Size changed from 4KB to 60KB for each write. Fit more Log Records in a single Write IO. (Less IOs, Large IO Size, Faster Query Time)
Transaction Log Internals:
1. Every SQL Server database has a Transaction Log which maps over one or more files. Conceptually, the Log File is a string of Log Records. Physically, the sequence of Log Records is stored efficiently in the set of physical files that implement the Transaction Log. Each file is divided into a number of Virtual Log Files(VLFs) that are used to store information about transactions/operations. When a VLF is full, logging continues to write into the next available VLF.
2. Writing can occur to only one Transaction Log file at the time. Parallel I/O operations are not possible. So adding multiple Transaction Log files to a database is possible but it will not improve performance. Multiple transaction log files are good if the first log file is full or the disk is low on space.
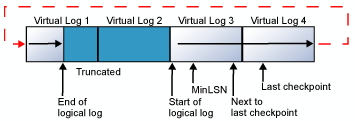
3. Transaction Log file is a critical part of a SQL Server database transactions. A re-playable component needed to roll forward committed transactions and roll back uncommitted transactions in the event of an outage/disaster.
4. The Transaction Log file is a circular file. Logical Log is the active part of the Transaction Log. MinLSN is the starting point of the oldest active transaction. Log truncation frees any VLFs whose records all appear in front of the MinLSN. When the end of the Logical Log reaches the end of the physical log file, the new Log Records wrap around to the start of the physical log file.
5. You can view the number of VLFs existing by using DBCC LOGINFO. Proper sizing of the Log File and growth increment are important to ensure good performance with database startup, backups & restores. Many, small VLFs can affect performance.
6. If the Transaction Log contains multiple physical log files, the Logical Log will move through all the physical log files before it wraps back to the start of the first physical log file. If the end of the Logical Log reaches the start of the Logical Log, filegrowth takes place depending on the setting and if enabled or not. Ideally, old log records are truncated frequently and this doesn't need to occur often. It comes back to proper sizing of the log and proper growth increments.
7. Virtual Log Files are divided into Log Blocks which are between 512B and 60KB. Log Blocks contain Log Records.
8. Each Log Record is identified by a unique number / key called a Log Sequence Number(LSN). An LSN number consists of three parts: VLF Sequence Number, Log Block Number, Log Record Number. LSN #'s increase so the next Log Record has a higher LSN #. Each Log Record contains the ID of the Transaction that it belongs to.
9. Log Buffer is the Memory Structure to store Transaction Log Records per database. When a transaction is committed, entire Log Buffer(MEM) will be written to Transaction Log File(Disk) before commit finishes. IO size here ranges from 512B(min)(typical Disk Sector Size) to 60KB(max).
10. Log Writer is the process to write the Log Buffer/Log Block/Log Records to disk. Every instance of SQL Server has only one Log Writer. Log Writer handles all the Log Buffers for each database. Log Writes are sequential, with varying IO size, which is dependent on the the SQL Server Workload.
11. SQL Server uses a Write-Ahead Mechanism(WAL) to guarantee the Logs to be written before the flushing Data Pages. Flushing occurs on a Commit or Rollback or Log Buffer hits 60KB or Data Page is being written to disk or a Checkpoint as that causes Logs to be flushed because it writes all the dirty pages to the disk.
12. While a record is being modified:
- Exclusive lock will be applied to that record
- Data Page in the memory gets modified
- Log records will be generated & stored in the Log Buffer
- Upon Transaction commit, the Log Writer will flush/write the Log Buffer to the Transaction Log on File/Disk
- Exclusive Locks are removed
- Transaction completes
- Client gets a successful commit message
Transaction Logging: TSQL --> Transaction --> Log Records(MEM) --> Log Buffer(MEM) --> Log Flush(Log Writer)(WAL) --> LDF(VLFs/Log Blocks/Log Records/TransactionIDs)(Disk)
...hardened/commit success
As per Microsoft: "Fully durable transaction commits are synchronous and report a commit as successful and return control to the client only after the log records for the transaction are written to disk. Delayed durable transaction commits are asynchronous and report a commit as successful before the log records for the transaction are written to disk. Writing the transaction log entries to disk is required for a transaction to be durable. Delayed durable transactions become durable when the transaction log entries are flushed to disk." More below in link Control Transaction Durability.
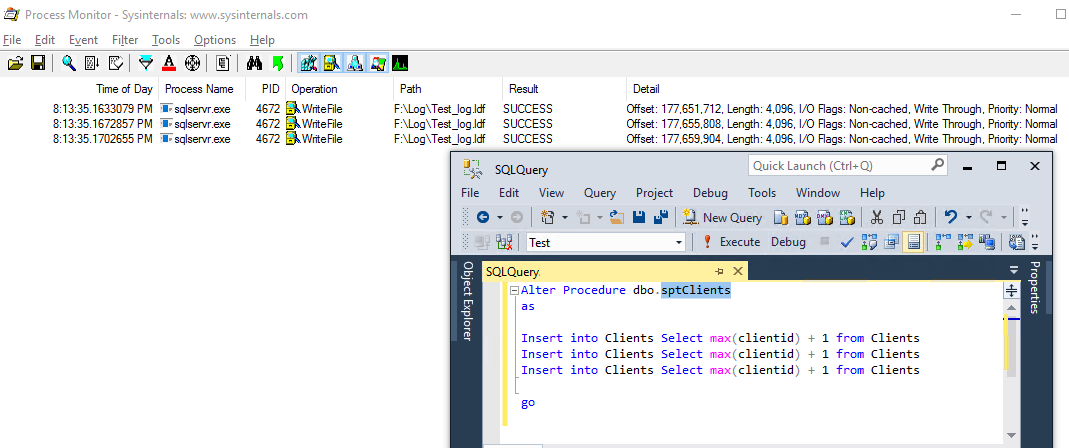
Case #3 - Stored Procedure - Implicit Transactions vs Explicit Transaction
3 IOs: (Writes)
1 IO: (Write)
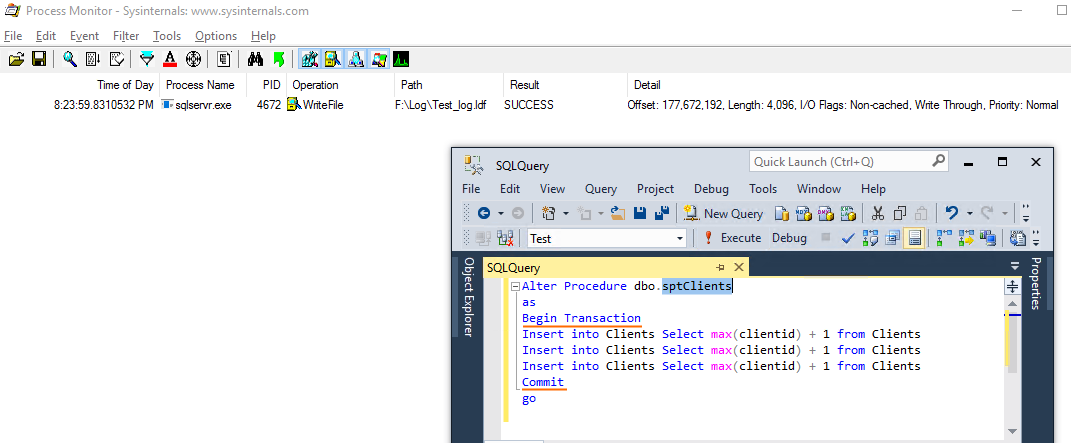
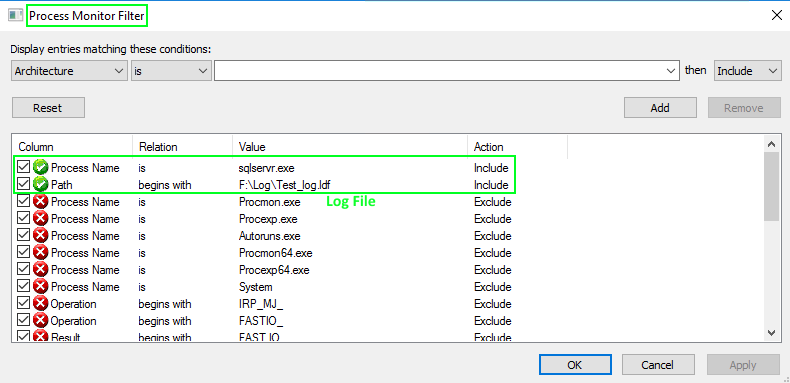
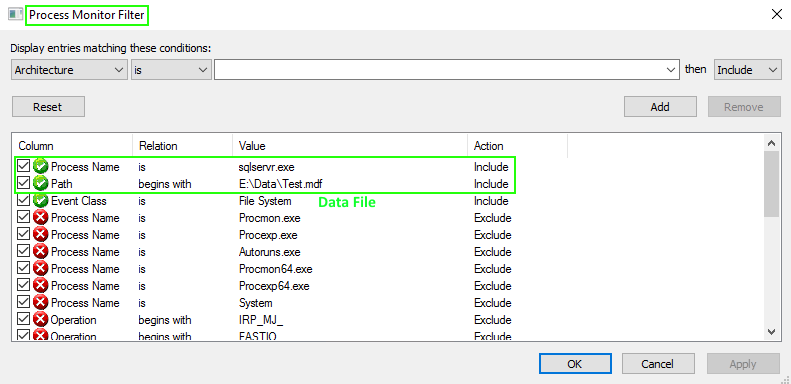
Process Monitor - Filter:
READ IOs from DB Data File:
DBCC FREEPROCCACHE
DBCC DROPCLEANBUFFERS
Select * from dbo.Clients
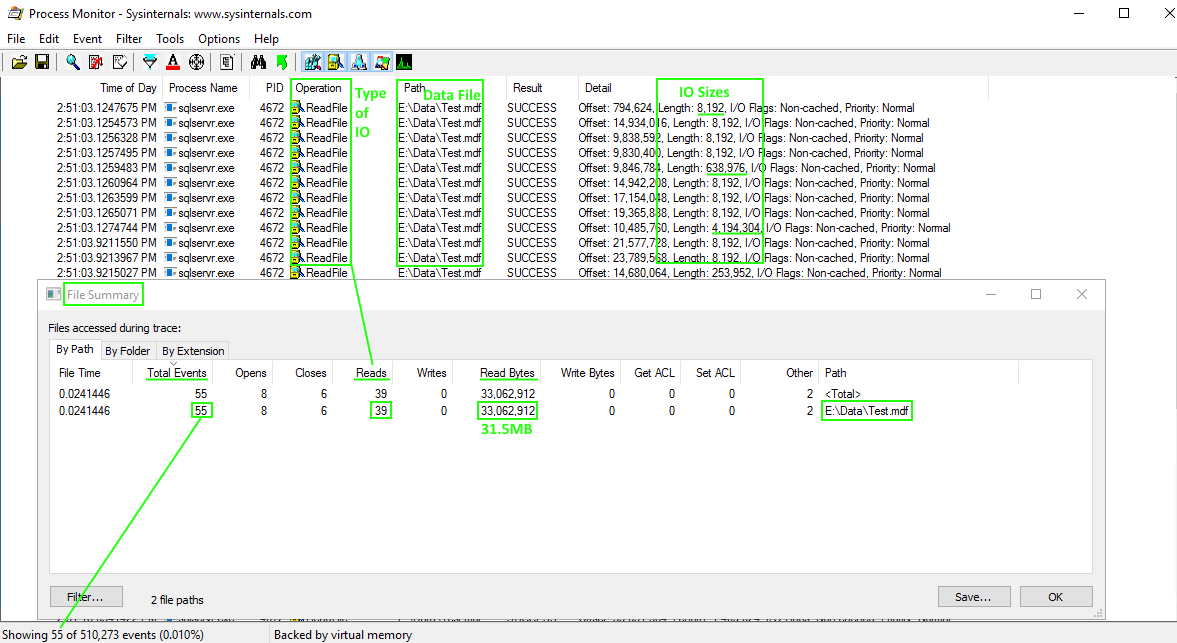
Tools to Analyze Data Sizes:
Total Rows:
Select count(*) from dbo.Clients
2500000
Total Column Data Size:
Select DATALENGTH(ClientID) from dbo.Clients (Column Length - INT(4 bytes)
Select SUM(DATALENGTH(ClientID)) from dbo.Clients
10,000,000 bytes = 10MB
ClientID column is INT(4 bytes) | 2,500,000 rows x 4 bytes = 10,000,000 bytes
Total Record Size:
SELECT * FROM sys.dm_db_index_physical_stats (DB_ID(N'Test'), OBJECT_ID(N'dbo.Clients'), NULL, NULL , 'DETAILED');
DBCC SHOWCONTIG ('dbo.Clients');
Clustered Index page_count 4020 record_count 2,500,000 avg/min/max_record_size_in_bytes 11 avg_fragmentation_in_percent 0.348
2,500,000 records x 11 bytes = 26MB
Total Table Size:
sp_spaceused 'Clients'
2,500,000 rows | reserved 32,328KB | data 32,160KB | index_size 128KB (Table Size: Extents/Pages/Index/Data)
SET STATISTICS IO ON
Select * from dbo.Clients
Table 'Clients'. Scan count 1, logical reads 4036, physical reads 3, read-ahead reads 4032
read-ahead reads = 4032 (This is Physical IO/Disk)
4032 means # of 8K pages: 4032 * 8 = 32256KB
Execution Plan: Estimated Data Size: 26MB
SSMS: Include Client Statistics: Bytes Send from Server = 12MB
Overall Data Sizes from Storage/Disk to Network to Client:
Column Data Size (~10MB) --> Record Data Size(~26MB) --> Table Size (~30MB) --> TDS/Network --> Bytes sent to Client (~12MB)
sp_configure:
network packet size (B) - 512(min) | 32767(max) | 4096(config_value) | 4096(run_value)
msinfo32:
Disk Sector Size - 512 bytes (System Summary..Components..Storage..Disks) (Use Disk Management to get the Disk #) (Azure VM image w/ MSSQL installed)
Process Monitor - Filter:
Use a DMV to get Data & Log Files IO Usage/Statistics in order to analyze IO from within SQL Server:
What file is the busiest? What IO operation is it? What are read and write latency? Has the latency increased? Is the latency
above the recommended guidelines?
sys.dm_io_virtual_file_stats returns I/O statistics for data and log files. ***This data is since the database was brought online.
Num_of_Reads_from_File and Num_of_Writes_to_File shows how many Inserts/Deletes vs Selects are.
IO_Stall_Read_ms - Total time, in milliseconds, that the users waited for reads issued on the file.
IO_Stall_Write_ms - Total time, in milliseconds, that users waited for writes to be completed on the file.
Declare @dbname varchar(150) = 'Test'
SELECT
DB_NAME ([vfs].[database_id]) AS 'DB',
mf.Name AS 'File - Logical',
Upper(Substring(physical_name, len(physical_name)-3, 4)) As 'File - Physical',
IO_Stall_Read_MS, Num_of_Reads as 'Num_of_Reads_From_File',
[ReadLatency_MS] = CASE WHEN [num_of_reads] = 0 THEN 0 ELSE ([io_stall_read_ms] / [num_of_reads]) END,
IO_Stall_Write_MS, Num_of_Writes as 'Num_of_Writes_To_File',
[WriteLatency_MS] = CASE WHEN [num_of_writes] = 0 THEN 0 ELSE ([io_stall_write_ms] / [num_of_writes]) END,
[Latency_MS] = CASE WHEN ([num_of_reads] = 0 AND [num_of_writes] = 0) THEN 0 ELSE ([io_stall] / ([num_of_reads] + [num_of_writes])) END,
[AvgBPerRead] = CASE WHEN [num_of_reads] = 0 THEN 0 ELSE ([num_of_bytes_read] / [num_of_reads]) END,
[AvgBPerWrite] = CASE WHEN [num_of_writes] = 0 THEN 0 ELSE ([num_of_bytes_written] / [num_of_writes]) END,
[AvgBPerTransfer] = CASE WHEN ([num_of_reads] = 0 AND [num_of_writes] = 0) THEN 0 ELSE
(([num_of_bytes_read] + [num_of_bytes_written]) / ([num_of_reads] + [num_of_writes])) END,
LEFT ([mf].[Physical_Name], 2) AS [Drive],
[mf].[Physical_Name],
[vfs].[File_ID]
FROM
sys.dm_io_virtual_file_stats (NULL,NULL) AS [vfs]
JOIN sys.master_files AS [mf]
ON [vfs].[database_id] = [mf].[database_id] AND [vfs].[file_id] = [mf].[file_id]
WHERE
(@dbname IS NULL OR (@dbname = DB_NAME ([vfs].[database_id])))
ORDER BY [WriteLatency_ms] DESC;
GO

Recommended guideline for good vs bad IO Latency:
Excellent: < 1ms
Very good: < 5ms
Good: 5–10ms
Poor: 10–20ms
Bad: 20–100ms
Really bad: 100–500ms
Awful: > 500ms
If Read and Write latency are too high AND causing performance issues, you need to figure out why. Below is a short list of some possible causes to look into.
- SQL Server workload - has it changed?
- IO Subsystem - has it changed?
- Indexing Strategy - has it changed? Incorrect indexes can lead to more data being read from disk. (i.e. Index Scans vs Index seeks)
- Statistics - are they out-dated? Statistics are a key component that the Query Optimizer has to making good execution plans decisions.
- Access Pattern - has it changed? Are extra Page Reads/Writes occurring?
- Buffer Pool - is it under memory pressure? What items are stored in Buffer Cache? What items are stored in Plan Cache?
- Parameter sniffing - is this occurring?
Get Transaction Log Size and VLFs:
Transaction Log - Number of VLFs and VLFs Total Size (*Total VLF Size = ~ LDF Size):
Declare @Tbl Table (RecoveryUnitd tinyint, FileId tinyint, FileSize bigint, StartOffset bigint, FSeqNo int, [Status] tinyint, Parity tinyint, CreateLSN numeric(25,0));
Insert into @Tbl EXEC ('DBCC LOGINFO');
Select Count(*) as 'Total Number VLFs', SUM(FileSize) as 'Total Bytes', SUM(FileSize)/1024 as 'Total KB', SUM(FileSize)/1024/1024 as 'Total MB' from @Tbl
Database File Sizes:
SELECT DB_NAME(database_id) AS 'Database', [Name] AS 'Logical_Name', Physical_Name, (size*8)/1024 'SizeMB'
FROM sys.master_files
WHERE DB_NAME(database_id) = 'Test'
GO
DBCC LOGINFO - Status Column:
Status has two possible values: 0 and 2. 2 means the VLF is active / not reusable and a value of 0 means it is reusable.
View Transaction Log Records in the active part of the transaction log file for the current database:
Truncate Table dbo.Clients
Checkpoint
Insert into dbo.Clients Select 1000
select
[Current LSN], [Operation], Context, [Transaction Name], [Transaction ID], [AllocUnitName], [Page ID], [Slot ID], [Description],
[Lock Information], [Num Elements], [RowLog Contents 0], [RowLog Contents 1], [RowLog Contents 2], [Checkpoint Begin], [Checkpoint End],
[Oldest Active LSN], [Oldest Active Transaction ID], [Oldest Replicated Begin LSN],
[Num Transactions], [Dirty Pages], [Replicated Records],
[Pages Written], [Command Type], Command,
[Log Record Fixed Length], [Log Record Length]
from fn_dblog(null, null)
From Microsoft Docs:
A checkpoint creates a known good point from which the SQL Server Database Engine can start applying changes contained in the log during recovery after an unexpected shutdown or crash. For performance reasons, the Database Engine performs modifications to database pages in memory—in the buffer cache—and does not write these pages to disk after every change. Rather, the Database Engine periodically issues a checkpoint on each database. A checkpoint writes the current in-memory modified pages (known as dirty pages) and transaction log information from memory to disk and, also, records information about the transaction log. An automatic checkpoint occurs each time the number of log records reaches the number the Database Engine estimates it can process during the time specified in the recovery interval server configuration option. Under the simple recovery model, unless some factor is delaying log truncation, an automatic checkpoint truncates the unused section of the transaction log.
Resources:
sys.dm_io_virtual_file_stats (Transact-SQL)
Control Transaction Durability
File Monitor - Download Process Monitor from sysinternals (LDF, MDF)
Disk IO Test - Download Diskspd Utility from Microsoft (Throughput, IOPS)
|
|
|
|
|
|
|
|
|
|